

Whether you are developing an app or a game, calculating Total Addressable Market (TAM, also known as Total Available Market) is necessary to understand how big the opportunity is.
The Total Addressable market is the expected size of your audience for your product, and calculating it is more of an art than science. This is because any calculations are often based on estimates and assumptions, so it’s important to be cautious when using them.

A common pitfall for startup founders is saying that the total addressable market of their product is the entire population of the planet earth. This is too broad to be of any help for marketing purposes.
Marketing budgets shrink with a recession, and with the democratization of digital advertising CPAs (cost per acquisition), are as high as ever. With the advent of increased privacy rules and consolidation in the digital product market, getting widely available access to trustworthy information becomes more difficult.
If you want to set specific ambitious but realistic objectives (SMART objectives), then having an idea of the size of an opportunity can help deconstruct and set better targets.
Whether you’re a startup founder, a small business owner, or work in a strategic support function, here are my top tips to estimate your addressable market when your access to information is very limited.
How to use total addressable market
The first step to start your estimation process is to understand why you need to calculate the total addressable market. What do you want to answer? Which opportunities are you interested in exploring?
Having focus is necessary to avoid excessively broad and unhelpful estimates. Also, generally, the broader the audience the more opportunity to accumulate estimation errors.
If you are working on a game some of your questions could be:
- What’s the size of the iOS mid-core male audience in the US?
- Is it worth it to localize my mobile game in Japanese?
- Should I go PC-first or mobile-first?
If you’re working on a digital product:
- Is it worth it to develop an Android version of this app?
- Should I try a new channel for advertising?
- Is this niche/audience big enough to sustain my business?
Main strategies to estimate TAM
There are several ways to calculate the total addressable market (TAM) for an app:
- Market sizing method: This involves estimating the size of the market by looking at factors such as the number of potential customers, their purchasing power, and the price of the product or service.
- Market penetration method: This involves estimating the percentage of the target market that the app can realistically capture and multiplying it by the total size of the market.
- Revenue potential method: This involves estimating the potential revenue that the app can generate by multiplying the number of potential customers by the expected price of the product or service.
The strategy you pick will be based on your objectives and the information that you have available. Gathering quality information on industry data is not trivial, and will directly affect the quality of your calculation.
Gathering Quality Information
Know the audience for your app and/or games
User research is often an overlooked discipline. But in 2023 creating user-centric products is a good way to optimize product market fit. The better you know who is going to use your product, the better-armed you are to understand the size of that group.
First-party data is often the most reliable data that you’re going to encounter.
If you have analytics coming in from your product, other products, or specific markets, you’re in a good position to compare that data with other industry benchmarks you come across. Investing in a good (privacy-compliant), analytics pipeline will increase your in-house know-how and can even become an asset when valuing your company.
Depending on how much management and ownership you want to have, some analytics platforms worth considering are:
- Amazon AWS https://aws.amazon.com/big-data/datalakes-and-analytics/
- Google Cloud Platform GCP https://cloud.google.com/
- Azure Analytics Services https://azure.microsoft.com/
- Unity Analytics https://unity.com/products/unity-analytics
Qualitative information is also extremely important to improve your audience knowledge. Questionnaires are a popular way to obtain this first-party information. If you want to estimate TAM, some points that you might want to focus on are:
- Demographic data. Eg. “Which country are you from?”
- Purchase power/usage. Eg. “How many times did you buy in-app purchases/services in the last year?”
- Competitors. Eg. “Which apps/services do you use for e-mailing?”
Know your competition
If you have a competitor that is a market leader, trying to get data on their audience can quickly give you some pointers that will inform your estimations.
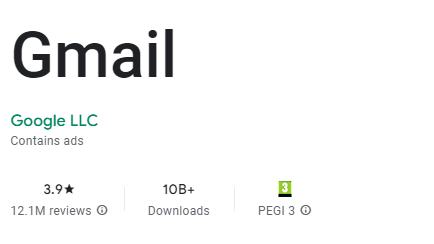
Eg. If you are creating an email management app for Android, the Gmail app having 10B downloads could be an ok place to start. After all, that app is preinstalled on a lot of devices and Gmail is one of the most popular e-mail services out there.
But then if you studied your audience, you might have learned that most people don’t want specialty email management services.
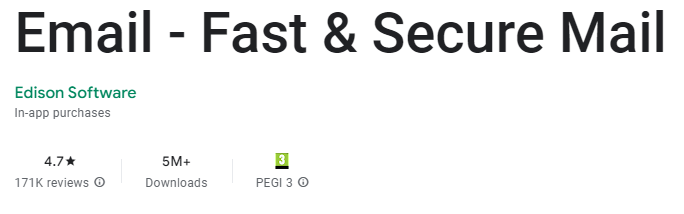
Other potential competitors like Edison Software’s “Email – Fast and Secure Mail” have ~5M installs.
On the playstore, you have some publicly available information on app downloads. And even though that information is limited, you have an idea about the order of magnitude.
Publicly listed competitors have a fiduciary duty to share information with their investors. Getting access to these quarterly reports for your main competitors should be considered mandatory reading. Searching “Name of the company + Investor Relations” can be a good place to start.
Some examples of publicly listed companies in games are:
- Roblox Investor Relations https://ir.roblox.com/overview/default.aspx
- Activision Blizzard Investor Relations https://investor.activision.com/
Getting access to specialized industry data and studies.
If you’re working with mobile apps or games, unless you have great first-party data, it’s difficult not to rely on services that collect third-party information, such as:
Using tools provided by advertising platforms can be a good way to gather some intelligence on the Total Addressable market or at least potential reach.
Many service providers these days are sharing information and creating Handbooks, seminars, and infographics as acquisition tools for their services. Signing up for some of these e-books, and mailing lists can give you access to some nuggets of industry data. One of my favorite resources in this category is “Think with Google” https://www.thinkwithgoogle.com/intl/en-154/ .
Understanding how much competitors are paying for an install and combating that data with typical app funnel and monetization benchmarks might provide us with some information. After all, at the end of the day companies shouldn’t be spending advertising money they have no hopes of recouping, right? In 2023, this is not necessarily true. There is a lot of advertising money spent without a good chance of recouping and advertising costs are extremely inflated. Still, it’s a good exercise to try to understand the relationship between LTV and Acquisition Spending.
Using Common Mathematical Distributions and benchmarks to estimate the Total Addressable Market
Some tools to help you improve your estimate include the Power Law/ Pareto principle.
“roughly 80% of outcomes come from 20% of causes”.
Aiming for understanding the order of magnitude as opposed to a specific metric can also help you.

In the picture above we see a chart of orders of magnitude. If someone has a salary/income of 10000$ per month, that’s an order of magnitude higher than someone who earns 1000$ per month, and an order of magnitude lower than someone who has a 100K$ income.
Sometimes knowing whether your niche is in the hundreds of thousands or millions is the difference between being able to justify spending a certain budget.
In the previous e-mail app example, we can see that Gmail has 10B downloads, while the other app had 5M downloads. If we believed that the second app was a market leader for the market we wanted to be in, that can help us understand that for our new e-mail app the opportunity and audience might (roughly), be in the order of millions.
Reverse engineering competitor data
If we have access to good-quality competitor data, using the market penetration method to calculate TAM becomes straightforward.
Market_penetration_rate = (number of customers ÷ Total_Addressable_Market) x 100
![\[ Market Penetration Rate = \frac{Number Customers}{Total Addressable Market}*100\]](https://danielafontes.com/wp-content/ql-cache/quicklatex.com-5fe2146b85d098426c7ff05d15f4b590_l3.png "Rendered by QuickLaTeX.com")
The only unknown is the market penetration rate. However, there are “magic numbers”/industry benchmarks that can aid us in this process.
From my experience, a typical average benchmark for market penetration for digital products is 0.5%-2%.
I found some sources that are a bit more optimistic and place this benchmark as 2-6% for consumer products and 10-40% for business products https://www.lightercapital.com/blog/what-is-market-penetration-strategy-definition-examples
Either way, using the previous e-mail app example. The total addressable market for a 3rd party e-mail app is
Competitor A: 5M
If we consider that Competitor A is well established and has reached a market penetration rate of 2%:
Total Addressable market = 250M
Beyond Total Addressable Market
You now have an estimation of your total addressable market. Where do you go from there?
One thing is the total addressable market, another is what slice can you actually reach with your channels, and an even smaller slice will be your target market.
Having an idea of the size of the market doesn’t tell us anything about, what “piece of the pie” it is realistic to reach using advertisement/sales channels (Serviceable Available Market), and what the company/service can actually provide services for (Target Market). For example, if you have a car workshop in city A, the TAM can be all car owners in city A. But then of all of these car owners, you can only reach 20% with your channels of social media and newspaper advertisement. And if all of this 20% would all of a sudden appear at your front door, you wouldn’t have the capacity to deliver the best customer experience to all. With digital products capacity problems are more scalable, but they still exist.

This image shows the relationship between TAM, Serviceable Available Market and Target Market. Public Domain.
Nevertheless, estimating the TAM will help you make strategic decisions in a world where the cost of reaching and the need for personalized tailored acquisition is key.
This includes:
- Localization
- Regional budget allocation
- Market Penetration
- Growth potential
It’s helpful to compare your TAM estimates to those of other companies in the same market to see if they are reasonable. Going to industry conferences and events is a good place to network, compare assumptions and share learnings.
If you’re interested in business analysis topics you might like:
Do you feel like you’re an analyst at heart, want to work with games, and don’t know where to start?