
In the first part of How reasoning about LTV, ARPDAU, and CPIs can help product development strategy (https://danielafontes.com/2019/10/20/reasoning-about-ltv-arpdau-and-cpi-helps-product-strategy-pt1/ ), we defined some KPIs (key performance indicators), that we can use to benchmark, analyze, and set targets for our product (a mobile game for example).
At the end of the previous article, we introduced a practical example to help us reason about LTV, ARPDAU, and CPIs.
Step 1: Set up the Business Goal
It all starts with a business goal or target. We decided to be inspired by Warren Buffet and make a strategy mobile game (let’s call it Daantje’s Empire), where we aim to get a yearly return on investment (ROI), of 20.8%.
Business goal: yearly return on investment (ROI), of 20.8%
Step 2: Study the market and understand the average CPI

With our business goal set. It’s time to look at the market and the competition. Mobile games in 2019 require paid user acquisition in order to scale. After some research, we found these average CPI for our biggest market, the US.
So, if we would release Daantje’s Empire, a strategy game, in the US we could expect to pay on average 2.22$ (or around 2€), to acquire one player.
The next questions after we set our business target and analyze the market is to evaluate the game and set targets for the game, namely for retention metrics (how good are we able at keeping players engaged with the game), and ARPDAU on average (how much money do we make per user per day).
In order to achieve our business goal, we need an LTV_365 of CPI+0.25*CPI, which means that after 365 days we can expect the lifetime value at that point to be the cost of acquiring the player and 20.8% of that cost of installing as profit.
The easiest way to reason about retention is to use the Power Law. This family of mathematical functions is very useful to model natural phenomena, and it’s most famous version is the Pareto distribution that gives us the “80-20 rule” or the Pareto principle that states that “for many events, roughly 80% of the effects come from 20% of the causes.” (https://en.wikipedia.org/wiki/Pareto_distribution)
The best thing about the Power law is the ease of calculating expected value (average) from the curve because the integral (read area under the retention curve), has an easy mathematical function.
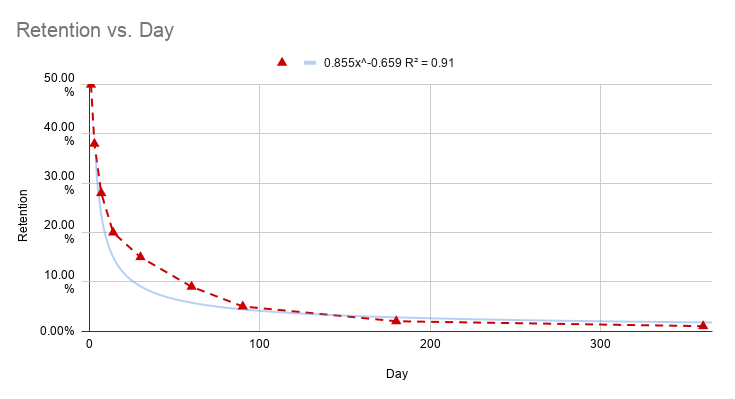
We can use google sheets to estimate our retention curve, like in the chart above.
Step 3: Estimate Retention Curve
Let’s start by gathering data on retention. This can be done in 3 ways:
- historical data from our game;
- data from another game that we have access to;
- or perhaps this is just a guess.
In the interactive chart that is represented by the triangles.

In the interactive chart above we have the modeled retention curve. The parameter R2 helps us understand how good our prediction is. The closer to 1 the best.
Step 4: Calculate the expected days in the game given the retention curve
As mentioned previously, the main advantage of using the Power Law method is its simplicity. The next step is to calculate the expected days in the game.
If we have an ARPDAU estimate, then from the expected/average days in-game we get the expected LTV for the period.
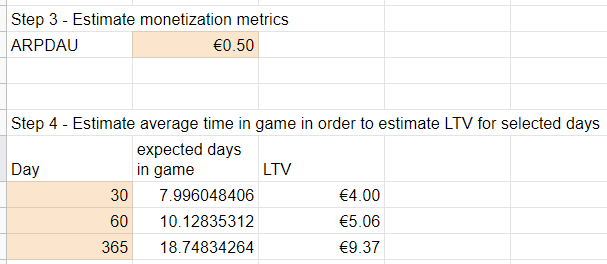
Estimating LTV from retention and ARPDAU
From this step alone, we can do simulations that allow us to understand where we’ll make most of our money.
Hypercasual games like Helix Jump (Voodoo 2018), or Archero (Habby 2019), plan their business in a way that they expect to make their money during the first 30 days of play. This means that LTV30 is the most important monetization metric for hypercasual games.
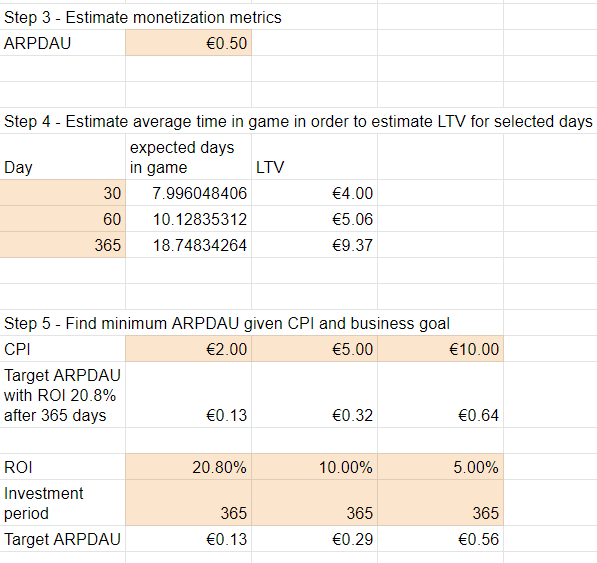
For our game Daantje’s empire, we try to focus on a 365-day window to calculate return on investment. In this example, we need a target ARPDAU of 0.13€ in order to satisfy our business goal requirement.
Let’s suppose now that our market would change drastically. We would be competing for CPIs of 5€, and we would adjust our ROI expectation to 10% yearly. Then, we would need to design our game in a way where we would attain an ARPDAU of 0.29€.
Full spreadsheet here:
I hope this article showed some of the reasoning that goes into the F2P User Acquisition driven business models. The model is not perfect but it’s a good place for anyone interested in product design. Understanding how monetization, retention, cost of acquisition are interdependent when we set our business goals is useful to detect opportunities.
Feel free to use the source sheet: https://docs.google.com/spreadsheets/d/1mzYkksuVMGCZdYa_B15_YGo10uuVYkRVSEERFPjzqbc/edit?usp=sharing